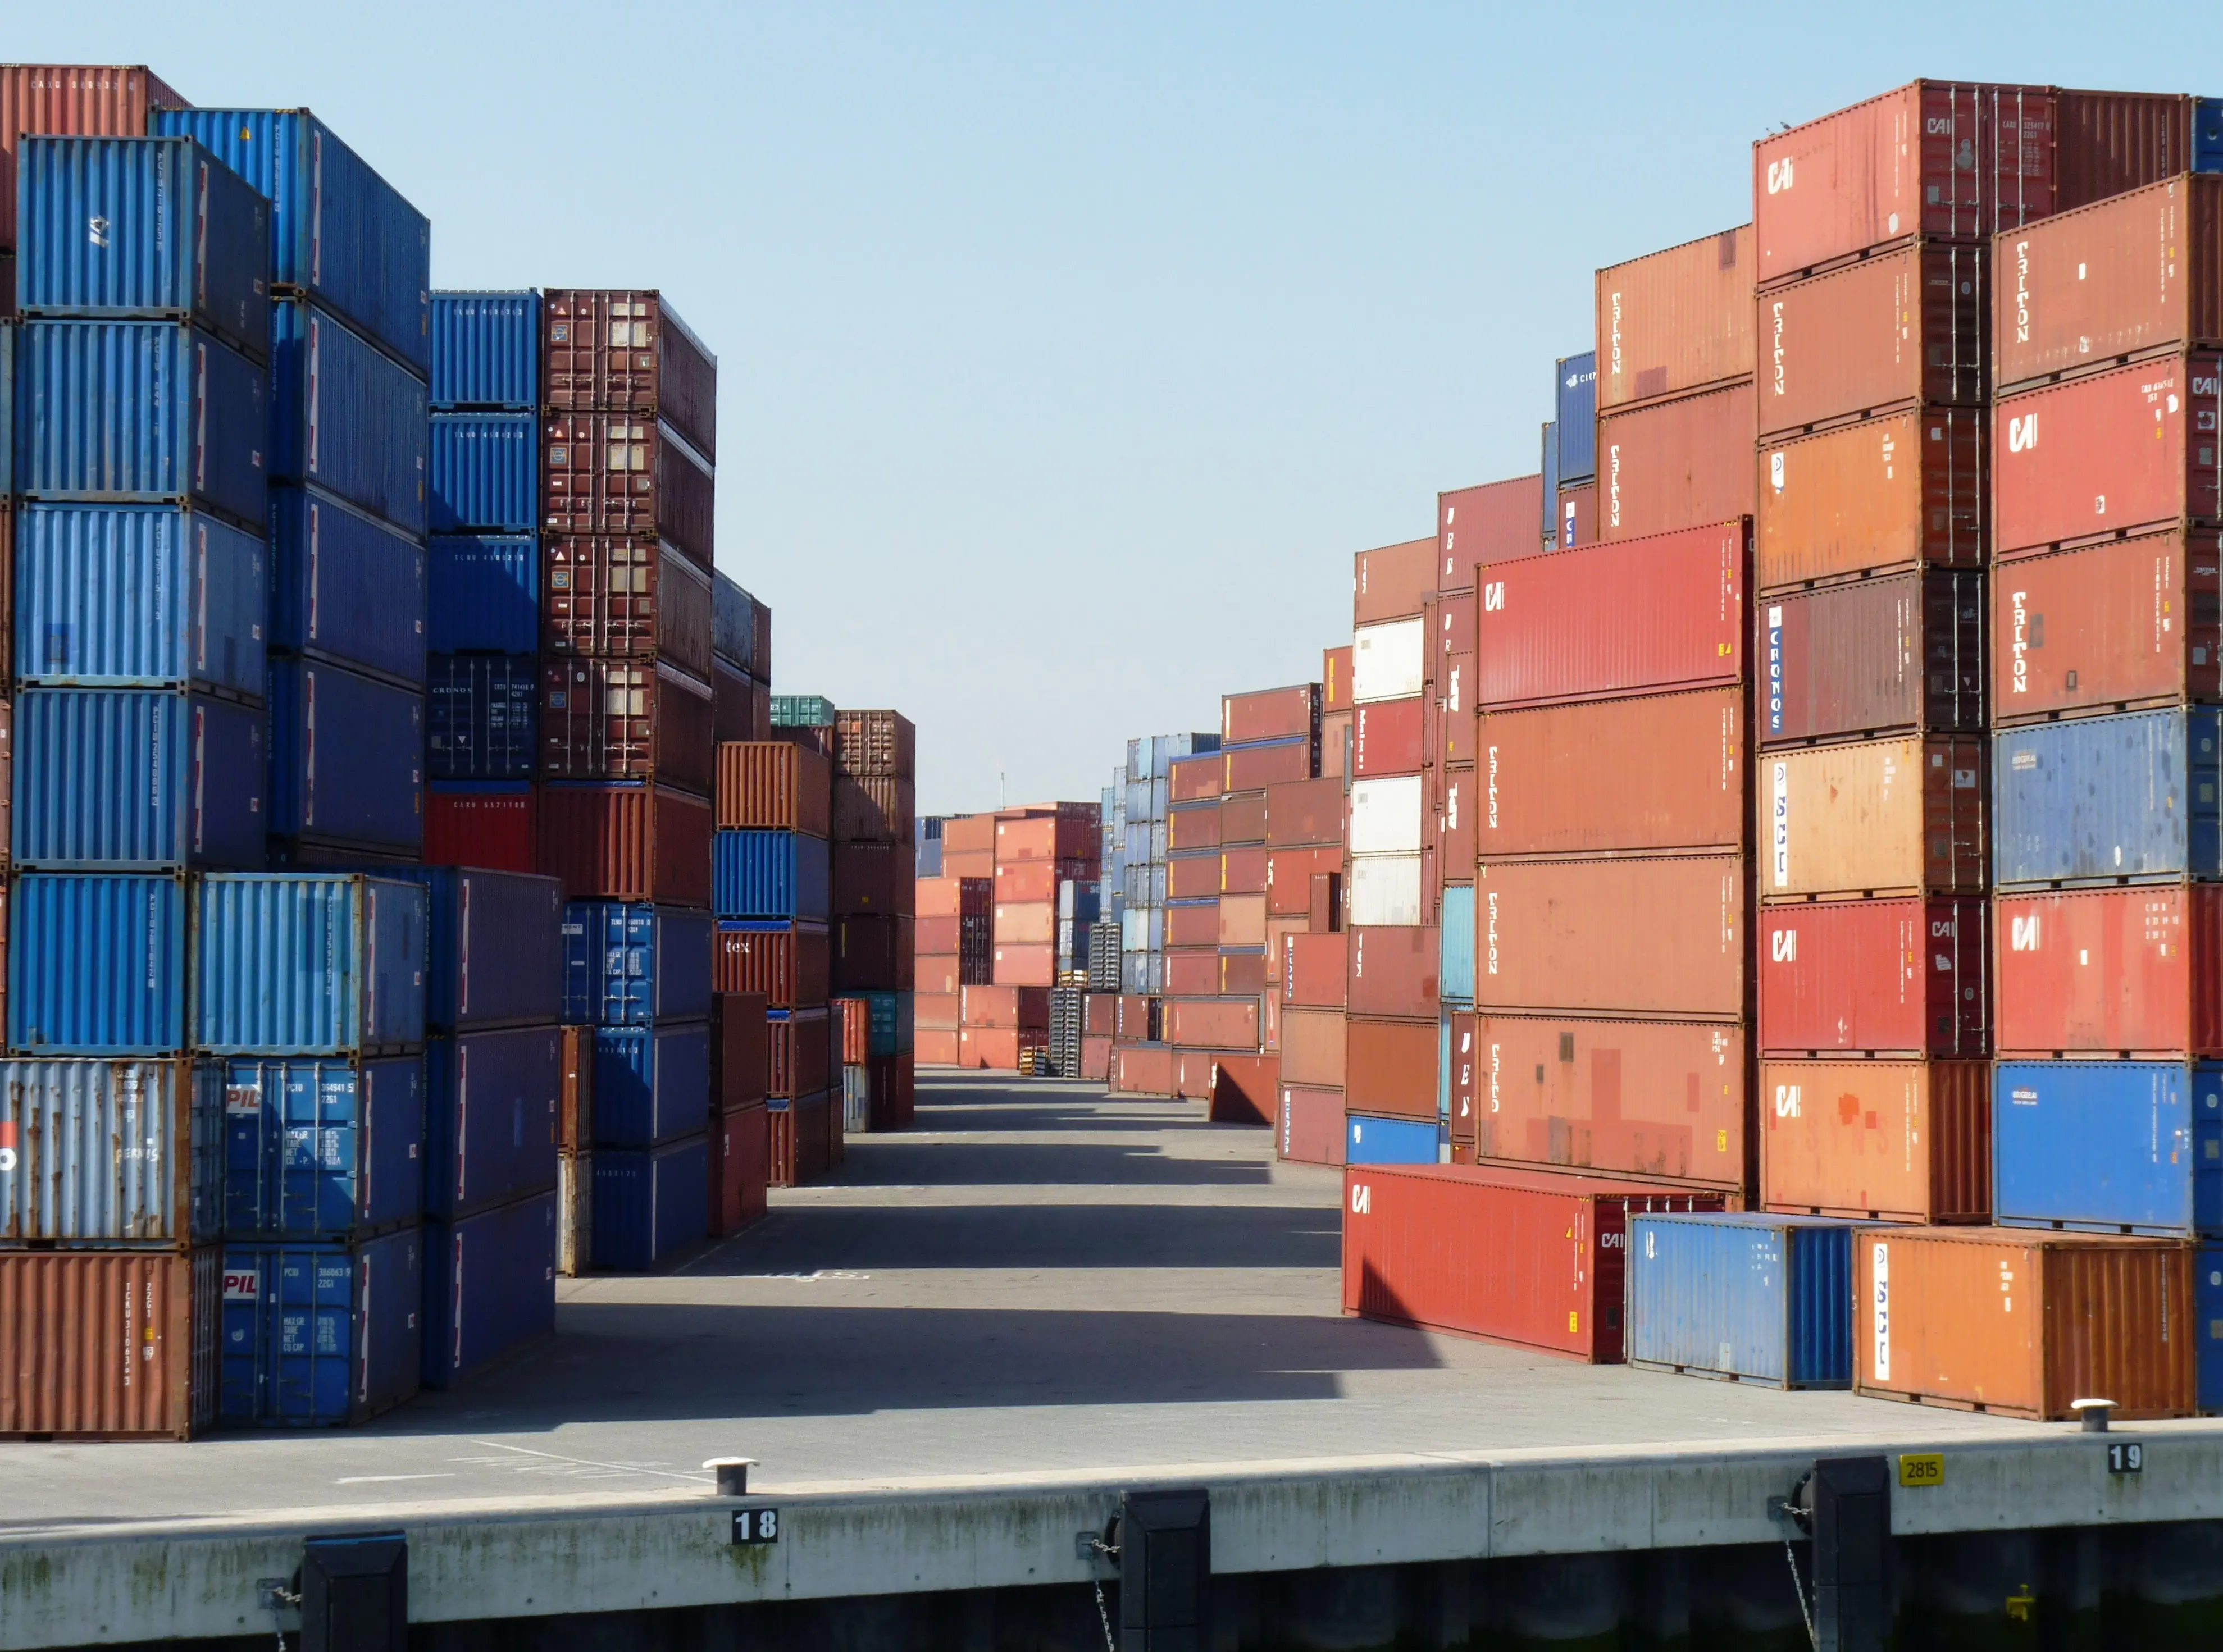

Utilisation is one of the most widely used KPIs for a container fleet. It is a single, clear percentage that shows how many containers are in use at any given moment. Useful for reporting, and at first glance often reassuring.
But a healthy percentage can hide a lot. Behind the same average there may be a shortage in one port and a surplus in another. Or a group of containers that has been idle for weeks while new ones are being leased elsewhere.
So the question is not only how many of your containers are being used, but above all which ones are not, where they are and why.
What one percentage does not show
Fleet-level utilisation is an average. And averages smooth out exactly the differences where the costs and opportunities are.
You probably recognise this:
- Overall utilisation looks fine, but containers are structurally idle at specific locations
- Certain container types are used far less than others, without anyone noticing
- Leased containers sit idle while owned containers are fully deployed, or the other way around
- It is unclear how long containers have been idle, and with which customer or in which status
- Every analysis requires manual work in separate files before a reliable answer is available
These may seem like details. Together, they determine what your fleet actually costs and earns.
Why this matters more than it seems
An idle container costs money. Lease costs continue, storage is charged and sooner or later the container has to be moved to a place where it is needed.
For container owners and leasing companies, it works the other way around. There, every idle day is a day without revenue.
When you only see the average, these effects remain hidden:
- Lease costs for idle containers continue unnoticed
- Repositioning happens reactively, once the shortage already exists
- Investment and leasing decisions are based on a distorted picture
- Opportunities to lease out or sell surplus capacity are missed
In other words: you are steering on a number that looks good, while margin is leaking away somewhere else.
From one number to an explainable picture
Utilisation only becomes actionable when you can break the percentage down. Not one figure for the entire fleet, but insight by:
- Container type
- Location
- Customer
- Status, such as available, in use, under maintenance or reserved
- Idle time, for example less than a week, one to four weeks or longer than a month
The question then shifts from "how high is our utilisation?" to "which containers need action now?"
The foundation: reliable container data
This kind of analysis is only as reliable as the data behind it. To measure idle time and utilisation properly, container movements, locations, statuses and timestamps need to be captured consistently. In the same way, at the moment they happen.
If a movement is missing, or a status is registered in different ways, idle time is no longer correct. And neither is utilisation.
This means:
- Movements and statuses are captured once, at the source
- Every event has a fixed meaning and a timestamp
- Operational data is directly connected to contracts and financial processing
What this changes in practice
When utilisation is visible down to container, location and customer level, container management becomes a matter of steering rather than reacting.
- Idle containers become visible before they create unnecessary costs
- Repositioning is planned based on actual availability
- Lease contracts are better aligned with actual deployment
- Surplus capacity can be leased out, deployed or sold in time
- Investment decisions are supported by reliable figures
And perhaps most importantly: you know not only how your fleet performs, but also why.
Why it matters
Containers are among the most critical assets in the maritime supply chain. Depending on your business model, they are a cost item, a source of revenue or both. In every case, if you only see the average, you miss where the difference is made.
Flex Maritime Logistics, built on Microsoft Dynamics 365, brings fleet management, availability and status, lease and sublease contracts, maintenance and invoicing together in one environment. This creates one reliable source of container data, as the foundation for a utilisation rate you can explain and act on.
Curious what lies behind your utilisation rate?
Would you like to gain more insight into the idle time, availability and return of your container fleet? Feel free to get in touch. We are happy to think along with you.